
The first RFID-based inventory system
that works with your lab.
No smart cabinets required.
Track lab consumables in real-time, so your research never stalls waiting for a restock.
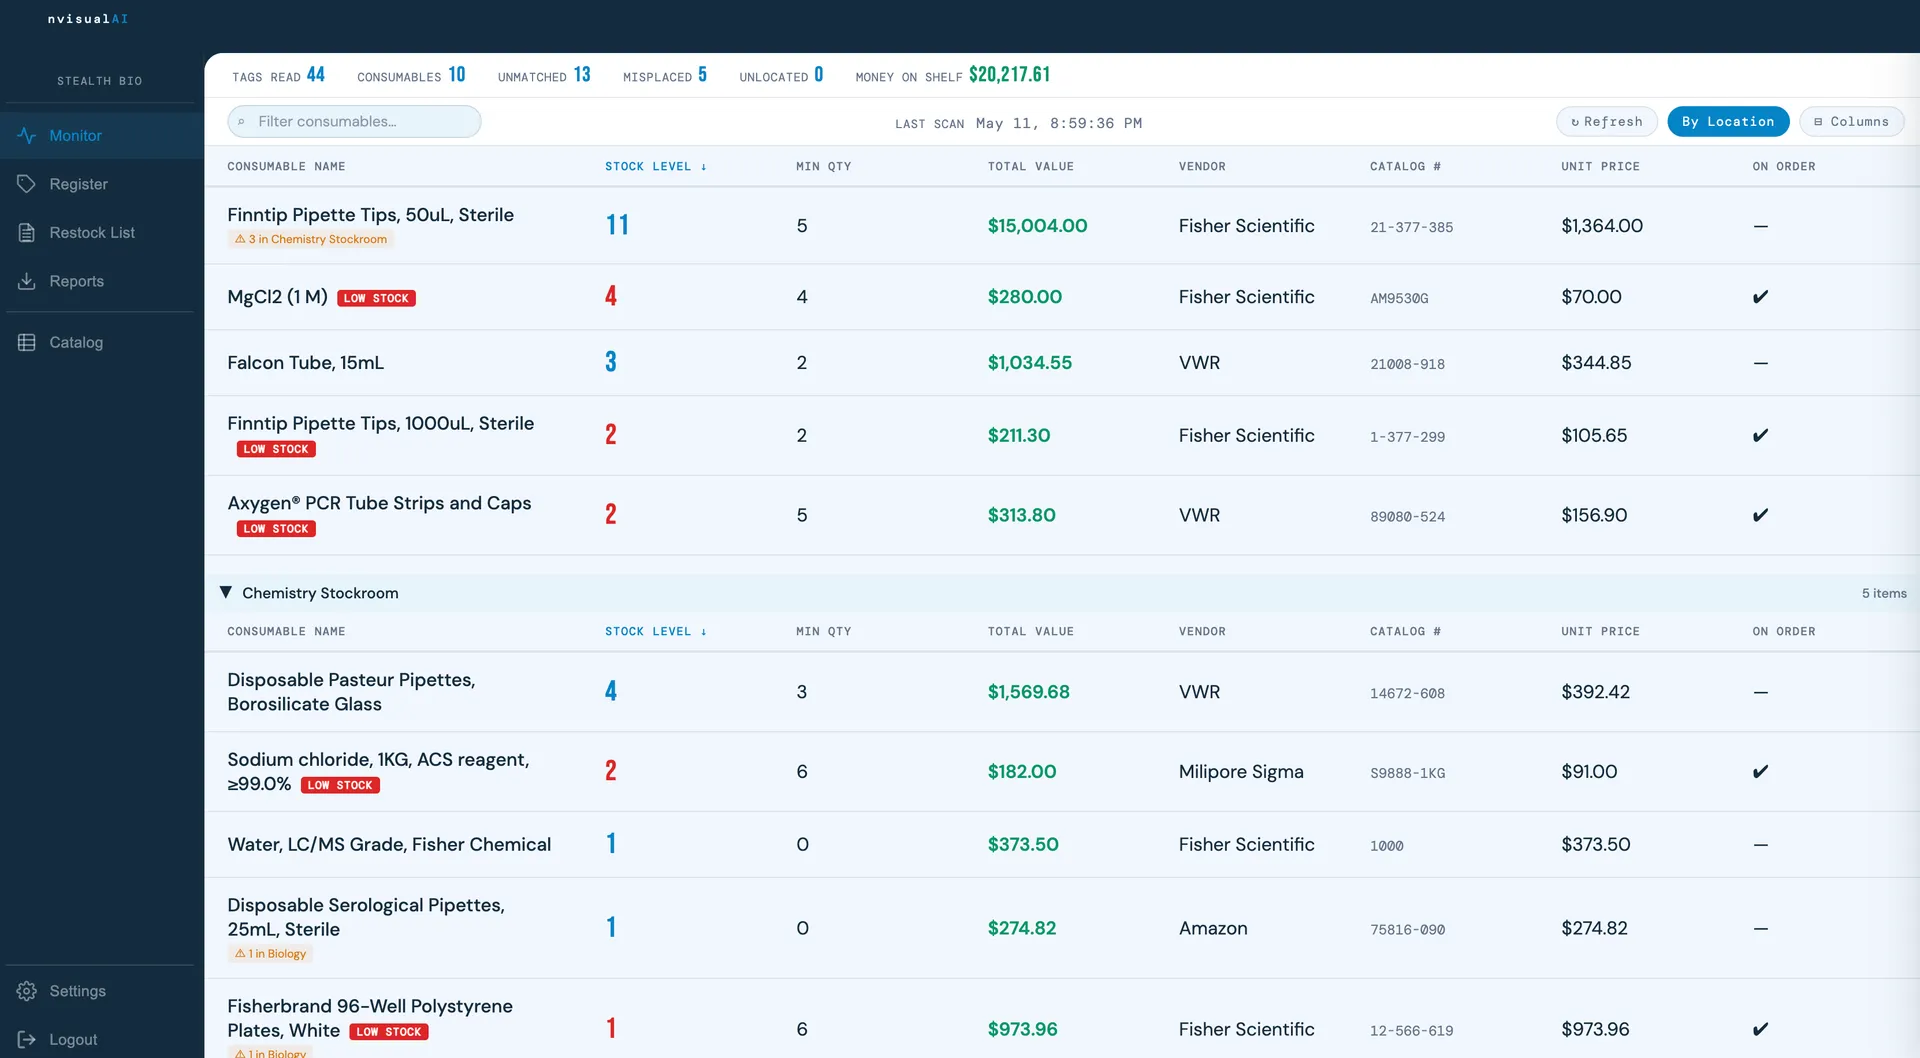
The hidden cost
of manual inventory.
- Shortages surfaced too late. By the time someone notices, experiments have stalled and timelines have slipped.
- Manual counts eat your budget. Labs spend thousands annually counting and reconciling inventory, work that adds zero scientific value.
- You are accountable for what you can't see. When a stock-out delays research, ops takes the blame, without the tools to have prevented it.
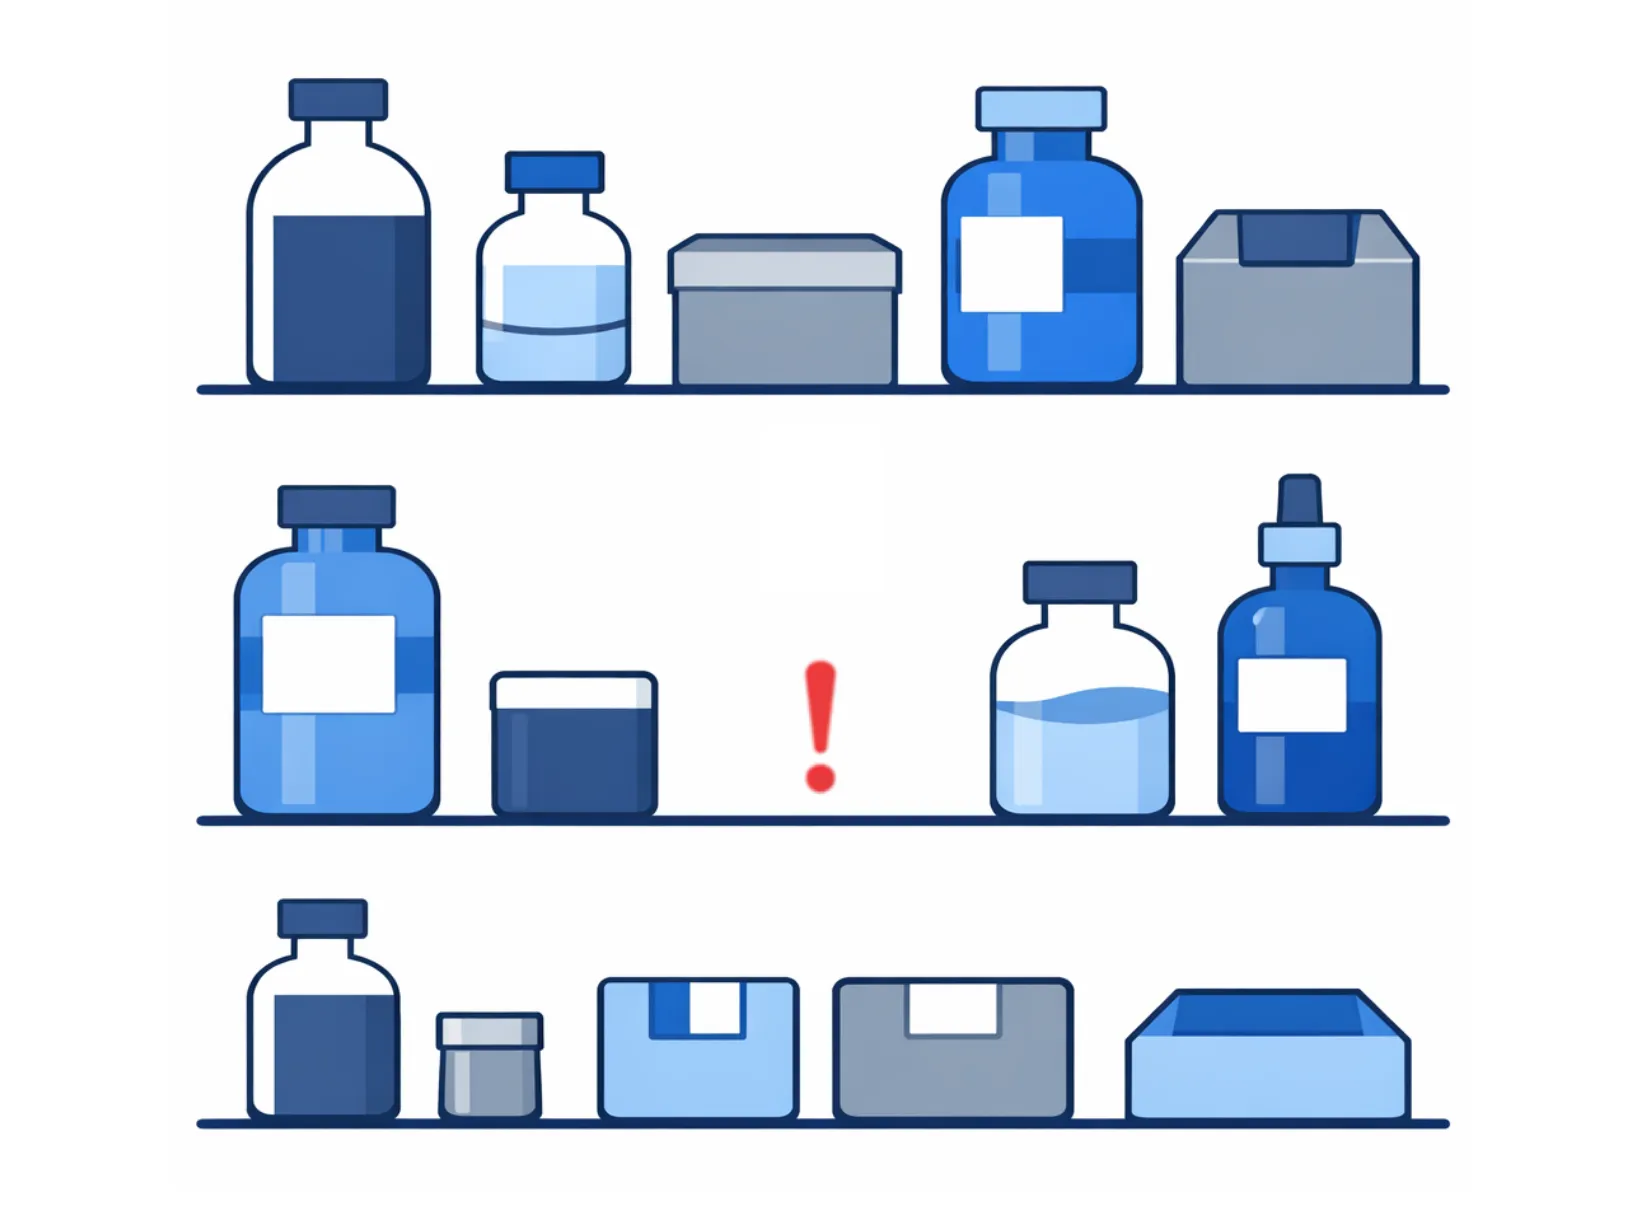
Passive by design.
Powerful by result.
- Tag once. RFID tags go on at intake. No ongoing effort required.
- Track always. Fixed readers detect removals passively. No scanning, no logging.
- Automated restock lists. Stock below threshold? The system flags it and auto-populates your order form.
- Accelerate ordering. Restock lists are pushed to your preferred procurement platform or emailed automatically.
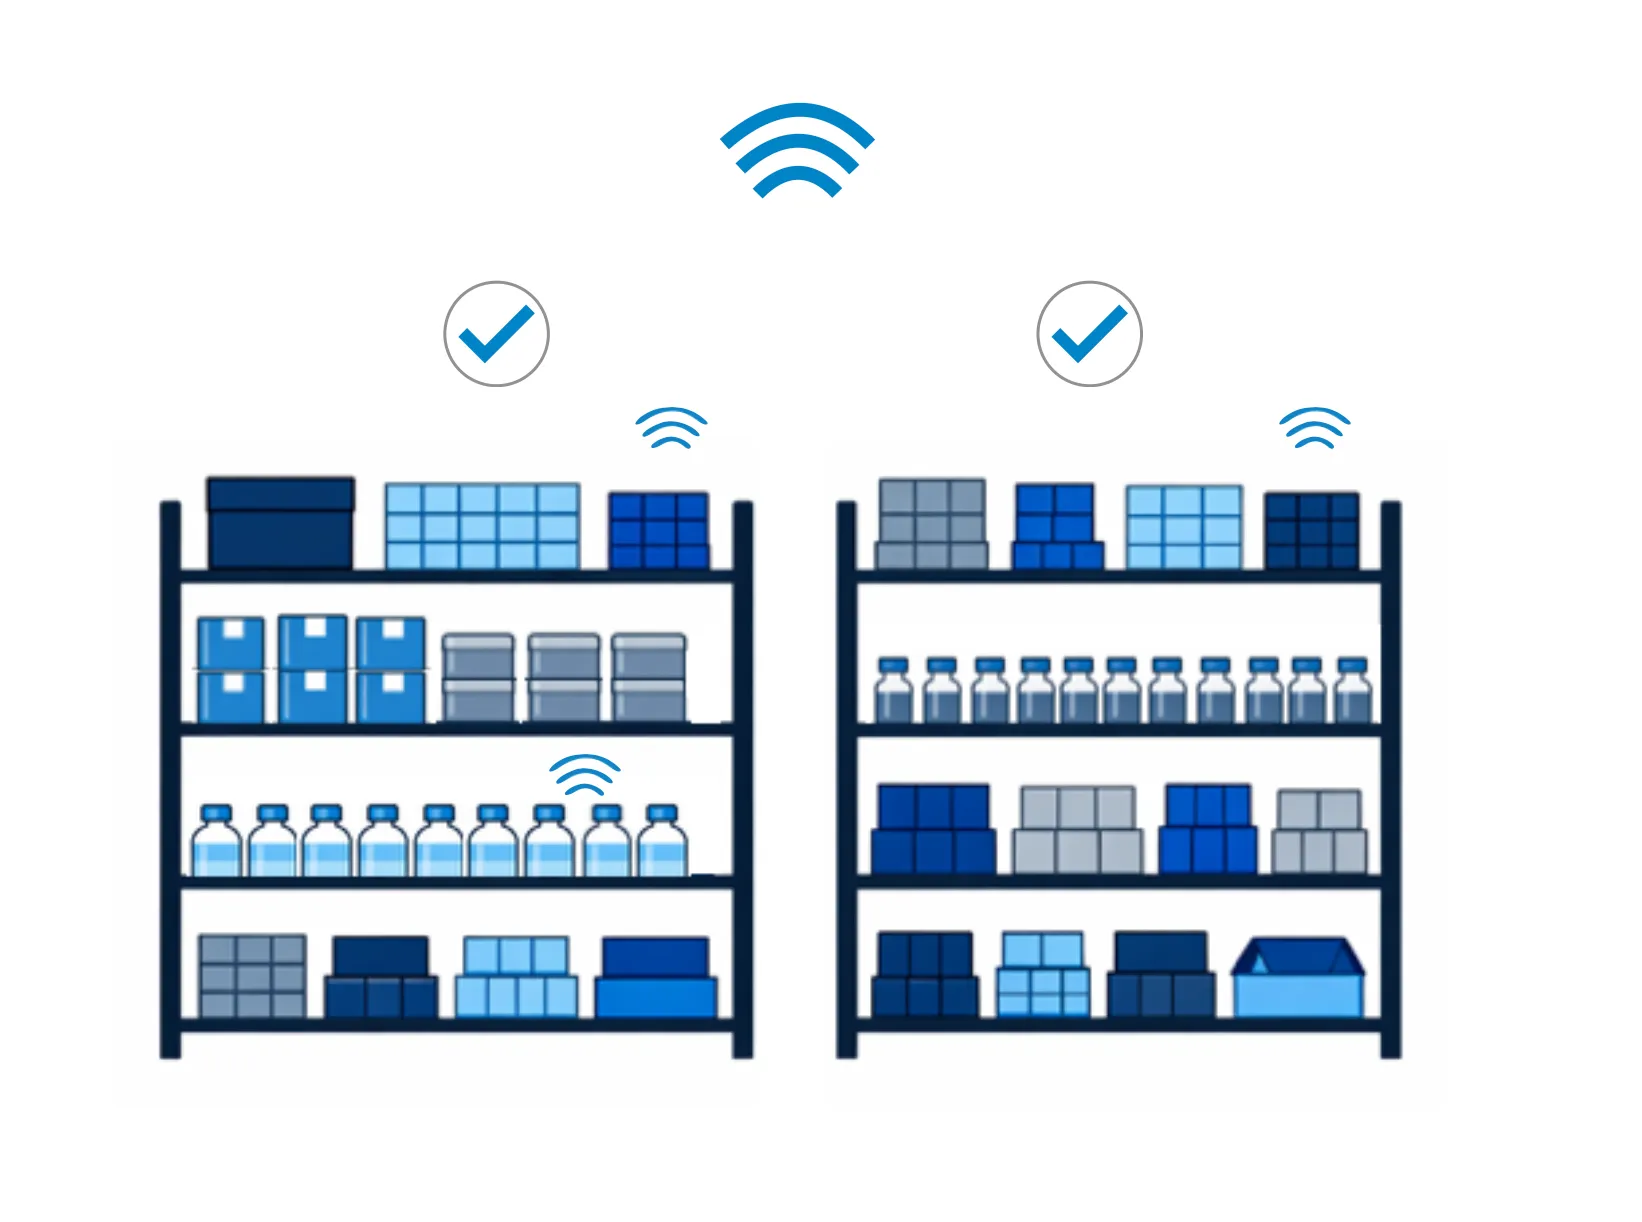
Research runs.
Overhead shrinks.
Labs that switch from manual inventory to automated RFID tracking eliminate the dual drain of operational overhead and research disruptions, replacing reactive scrambles with proactive, invisible control.
- Stock-outs become a thing of the past.
Low stock triggers a restock list and pushes to procurement automatically. - Measuring the numbers behind every reorder decision.
Optimize both shelf space and the capital tied up in inventory at any moment. - Misplaced items flagged before they become losses.
If a consumable leaves its zone, the dashboard flags it immediately. - Built for teams.
Role-based access ensures everyone sees what they need. - Zero behavior change for scientists.
No new workflow. No scanning.
After install, passive readers do the counting.
Every tagged item, every location.
Fixed readers track inventory continuously.
Your inventory data
is a strategic asset.
Every item removed from your stockroom tells a story. Passively collected RFID data doesn't just prevent stockouts; it builds a precise operational picture that reveals how your lab actually runs and where budget is silently leaking.
Stop overordering consumables.
By continuously measuring the variables that drive the reorder decision, you can optimize the reorder point while holding the least inventory that still meets your target service level.
See what your inventory is worth, right now.
Your dashboard shows the total dollar value sitting on your shelves in real time. The Money on Shelf Trend report tracks that number over weeks and months, turning your inventory data into a budgeting tool, not a year-end surprise.
Predict demand. Stop reacting to it.
Historical consumption data reveals when your lab orders and why. Recurring cycles and seasonal patterns become forecasting signals, turning budget planning from guesswork into precision.
Negotiate from a position of knowledge.
When you know exactly how much of what you buy, when, and from whom, you walk into vendor conversations with data. Consolidate suppliers, renegotiate terms, and use volume visibility to your advantage.
Discover how nvisualAI can work for you
Get a personalized onsite consultation, built around your business goals.
Request a consultation for a free trial
at consultation@nvisualai.com or using the form below.